Image

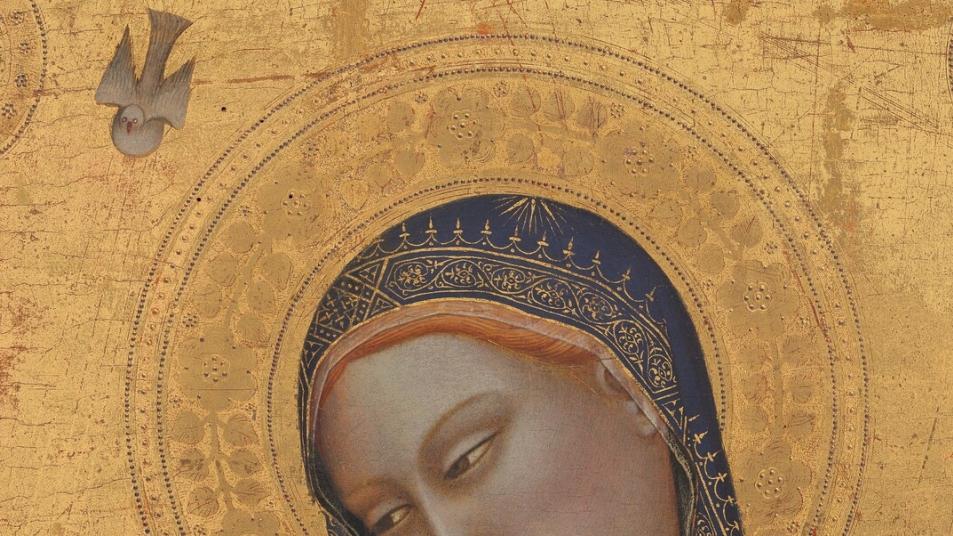
After more than six months of maturation, Datavirgo is online. This iconographic and digital visualization project aims to question the potentialities offered by the application of data science to Art History and more particularly to iconography.
Datavirgo analyzes the dynamics of an iconographic subject, its movement and concentration over regions and years, using interactive mapping.
Image
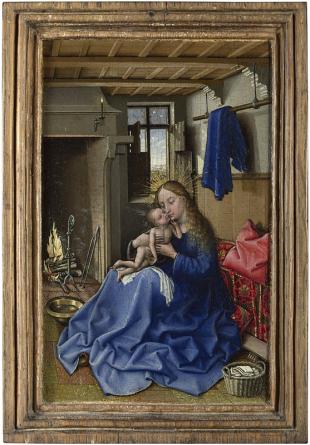
To this end, this project focuses on a concrete iconographic phenomenon, limited in time and space: the Virgin of Humility. Appearing around 1340, this motif, which is antagonistic to the Virgin in Majesty, is characterized by the fact that instead of being on a throne, the Virgin is seated on the ground or on a rudimentary support such as a cushion, a stone or a grass bench. It spread rapidly throughout Europe before declining in the 16th century.
The basis of this visualization is the concept of visual milieu developed by Pierre Francastel in Figure and Place [1967], referring to the set of social and artistic experiences that form a common visual culture among the spectators and artists of a same place or community.
Image
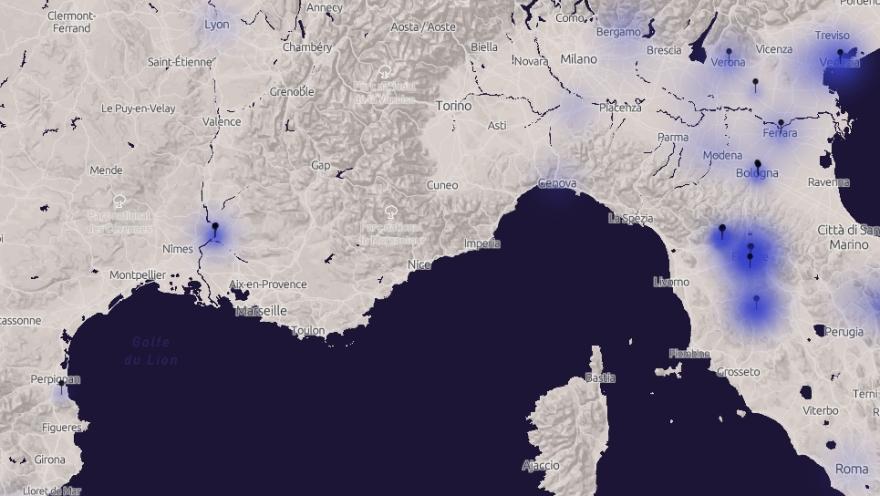
By mapping the provenance of the works, Datavirgo represents the influences and artistic models behind them, a kind of modeling of this visual environment, in this case of the Virgin of Humility, allowing different types of analysis. Combined with temporal visualization, this observation allows us to witness interesting phenomena that were previously difficult to see.
Method
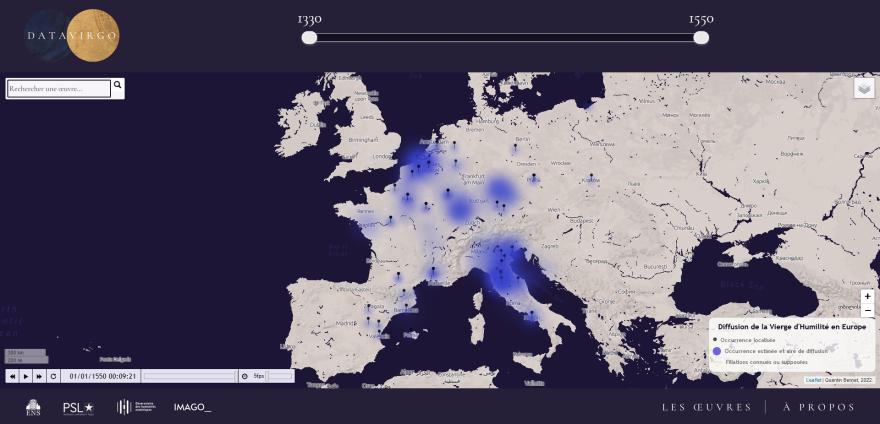
From the very beginning of the project, it was necessary to think about the conversion - a fundamental issue in digital humanities - of artistic objects into data, capable of being processed by computer. The works were gathered from different sources, museum catalogs, scientific works and even field research, and then put together in a dataset (a CSV file) structured around several variables: Index, title, creator, date (nominal), numerical dates (processed by the computer), spatial data, and then a series of iconographic variables, based on criteria that may or may not be present on the image. The dataset was processed with the Python library Pandas, the map was programmed in Javascript. In the data collected, the most important in terms of scientific method is the precision index: from 1 to 4, depending on the quality of the information about the work on its origin, its creator and its dating. This index directly modifies the size and opacity of the blue markers on the map. The black markers correspond to an index 1: a work of art that is perfectly localized (often a fresco that is still displayed in its place of creation). The chronological cursor allows you to display the markers included in a certain period. A simulator also allows you to create an animation that shows the development and dispersion of iconography, from 1340 to 1540. The search bar, finally, allows you to find a particular point.
Image
Results
This is how Datavirgo gives substance to the iconographic dynamics of the Virgin of Humility, mainly in the form of an interactive map, by representing the concentration of works in the form of a cloud. This cloud follows a logic similar to that of the heatmap: the differences in color (linked here to differences in opacity) express the different concentrations of works in different places. But this opacity also varies according to the source of the data and its precision. Thus, the cloud suggests, in an intuitive way, the rate of concentration and probability of presence of works at a given location, at a given time. This cloud can be refined on the basis of iconographic criteria, thanks to a system of filters: you can select one of the variations of the Virgin of Humility (example: the Virgin of the Apocalypse) and thus observe its distribution.
Image
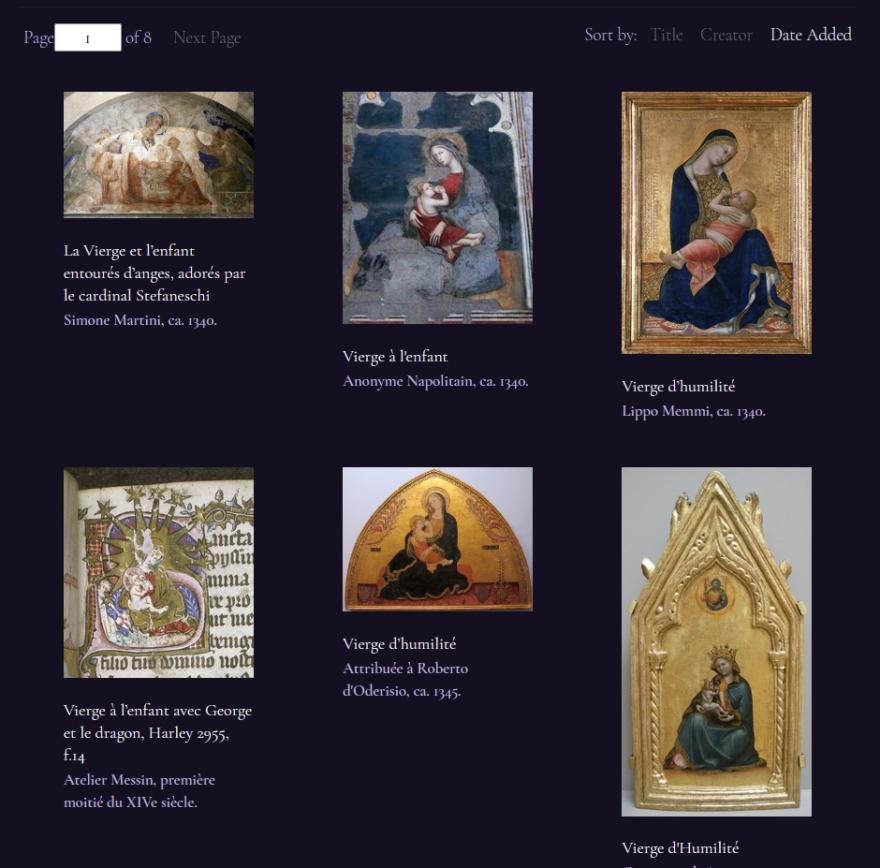
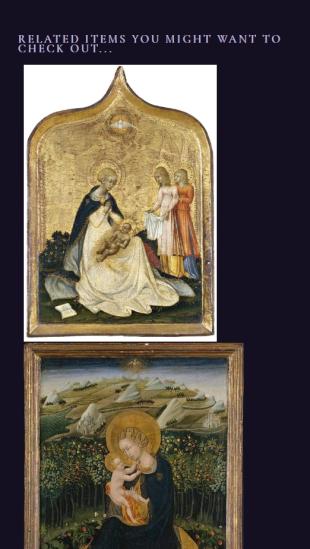
Datavirgo also includes a virtual gallery that allows you to browse directly through the works. This gallery offers a suggestion mode, which when selecting a work and based on spatial, temporal and artistic criteria, allows to suggest similar Virgins of Humility or from the same artistic-cultural environment.
Image
Image
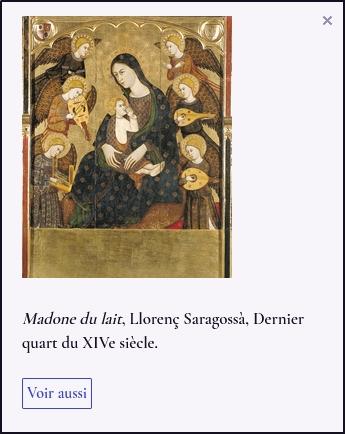
In the same logic, the markers of the map allow to display the different works to which they are attached, with in some cases the possibility to trace the work by discovering the linked models. These last functionalities allow a more dynamic and intuitive exploration of the corpus, and also make it possible to take into account the links inherent to the productions of the same visual environment.
Datavirgo shows how computer tools and data science open up new ways of modeling and iconographic analysis.
Project holder
Image
Quentin Bernet graduated from a khâgne in Art History at the Lycée Saint-Sernin in Toulouse. He holds a Master's degree in Art History from the Université Paris 1 Panthéon-Sorbonne and more recently a Master's degree in Digital Humanities from the École du Louvre, following a double course of study in these institutions. He is interested in questions of religious iconography, historiography and epistemology, around the study of the circulation of images in Europe in the 14th and 15th centuries. Today, he uses data analysis and visualization tools to question the perspectives opened by digital humanities in these fields, with a thesis project in preparation at EHESS.
Be the first to review this item, please login or register.
Sign-inRegister